Macro vs Micro Averaging for Multi-Class Problems
Why Averaging Matters
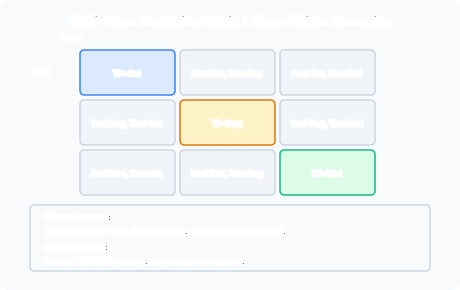
With more than two classes, a single precision/recall/F1 number per class tells only part of the story. We need a way to aggregate per-class metrics into one overall score. The choice between macro and micro averaging determines which classes drive the final number.
Macro-Averaging
Compute the metric (e.g., F1) for each class independently, then take the arithmetic mean across classes. Every class contributes equally, regardless of how many examples it has.
Best for imbalanced data where minority classes matter. If class A has 1000 examples and class B has 10, macro-F1 gives them equal weight. A poor F1 on the minority class will noticeably drag down the macro average.
Micro-Averaging
Pool all TP, FP, and FN counts across classes into global totals, then compute the metric on those pooled counts.
This is equivalent to computing accuracy (when each example has exactly one label). Large classes dominate; a minority class with poor performance barely affects the score.
Worked Example
Consider a 3-class problem with the following per-class counts:
| Class | TP | FP | FN | Examples |
|---|---|---|---|---|
| Hardware | 90 | 5 | 10 | 100 |
| Theory | 80 | 10 | 20 | 100 |
| Ethics | 5 | 5 | 15 | 20 |
Per-class F1:
- Hardware: Precision = 90/95 = 0.947, Recall = 90/100 = 0.90, F1 = 2×0.947×0.90/(0.947+0.90) = 0.923
- Theory: Precision = 80/90 = 0.889, Recall = 80/100 = 0.80, F1 = 0.842
- Ethics: Precision = 5/10 = 0.50, Recall = 5/20 = 0.25, F1 = 0.333
Macro-F1 = (0.923 + 0.842 + 0.333) / 3 = 0.699
Micro-F1: pool all counts.
Total TP = 90 + 80 + 5 = 175 Total FP = 5 + 10 + 5 = 20 Total FN = 10 + 20 + 15 = 45
Micro-Precision = 175/(175+20) = 0.897 Micro-Recall = 175/(175+45) = 0.795 Micro-F1 = 2×0.897×0.795/(0.897+0.795) = 0.844
The macro-F1 (0.699) reflects the poor Ethics performance. The micro-F1 (0.844) is dominated by the two large classes and hides the Ethics problem. When minority classes matter, report macro-averaged metrics; when overall throughput matters, micro-averaging suffices.
Summary
| Averaging | How | Weight | Best for |
|---|---|---|---|
| Macro | Per-class metric then average | Equal per class | Imbalanced data, minority classes matter |
| Micro | Pool all TP/FP/FN then compute | Proportional to class size | Overall throughput, balanced classes |
Past paper questions: y2023p3q8(b) (per-area evaluation)