Modelling for Communication: UML
Why Model?
Models abstract away complexity so that stakeholders can discuss, critique, and understand a system without reading 10,000 lines of code. A model is a simplified representation of reality, highlighting the aspects relevant to the current discussion and suppressing irrelevant detail.
UML (Unified Modeling Language) was standardised in the 1990s and defines 14 diagram types. Historically, some organisations attempted to generate entire codebases from highly detailed UML “Blueprints.” This largely failed — the diagrams became as complex as the code they were meant to simplify, and maintaining two synchronised representations (diagrams + code) doubled the maintenance burden.
Modern best practice is to use UML as sketches — informal, whiteboard-level diagrams that ignore strict syntax in favour of speed and clarity. If a diagram fits on a whiteboard and the team understands the design, it has served its purpose.
Class Diagrams: Static Structure
A class diagram shows what exists — classes, their attributes, their operations, and the relationships between them. It describes structure, not behaviour over time.
Anatomy of a class box:
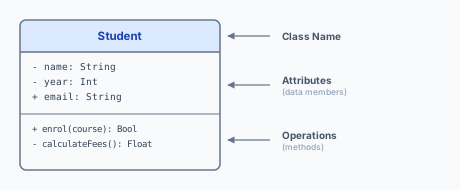
Visibility markers:
+Public — accessible by anyone.-Private — accessible only within the class.#Protected — accessible within the class and its subclasses.~Package — accessible within the same package.
Key relationships:
| Relationship | Notation | Meaning | Example |
|---|---|---|---|
| Association | Plain line | A general connection | Student is enrolled in Course |
| Inheritance (“is-a”) | Arrow with hollow triangle pointing to parent | Child is a specialised kind of parent | Undergraduate inherits from Student |
| Aggregation (“has-a”, independent lifecycle) | Line with hollow diamond at the container | Container holds parts, but parts can exist independently | Department has Professors; a professor can exist without the department |
| Composition (“has-a”, dependent lifecycle) | Line with filled/solid diamond at the container | Parts are created and destroyed with the container | Building has Rooms; demolish the building, the rooms cease to exist |
| Dependency | Dashed arrow | Class A uses class B temporarily (e.g. as a parameter) | ReportGenerator uses Database to fetch data |
Multiplicity can be annotated on either end: 1 (exactly one), 0..1 (zero or one), * (zero or more), 1..* (one or more). For example, a Student is enrolled in 1..* Courses, and a Course has * Students — the classic many-to-many relationship.
Sequence Diagrams: Dynamic Behaviour
A sequence diagram shows how processes interact over time — the order of messages exchanged between objects. It excels at modelling network calls, API interactions, and authentication flows.
Elements of a sequence diagram:
- Lifelines: vertical dashed lines extending downward from each participating object or actor. Time flows from top to bottom.
- Messages: horizontal arrows from one lifeline to another, representing a method call or signal. Solid arrowheads for synchronous calls; open (stick) arrowheads for asynchronous messages.
- Activation boxes: thin vertical rectangles on a lifeline, showing the period during which an object is actively processing (i.e. execution time).
- Return messages: dashed arrows going back, showing the return of control and optionally a return value (e.g.
200 OK).
Choosing the Right Diagram
| You are modelling… | Use a… |
|---|---|
| Database schema / entity relationships / static domain model | Class Diagram |
| How OAuth2 login flows between the browser, your server, and Google’s auth server | Sequence Diagram |
| What states a shopping cart can be in (Empty, Active, CheckedOut) and what events trigger transitions | State Machine Diagram |
| The high-level flow of an order from placement through warehouse to dispatch | Activity Diagram |
| How a product’s software modules are packaged and deployed to nodes | Deployment Diagram |
The Anti-pattern: Analysis Paralysis
Spending three weeks perfecting a UML diagram in a commercial modelling tool is usually wasted effort. By the time the diagram is finished, the requirements have almost certainly changed — because stakeholders learn about what they actually need by seeing working code, not by staring at diagrams.
Rule of thumb: if the diagram fits on a whiteboard and the team understands the design, it is good enough. Move on to building and testing. The diagrams that survive are the ones you draw retrospectively to communicate the design to new team members, not the ones you drew a priori to plan the design.
Expected Learning
- Name the main UML diagram types and know which to use for a given modelling task.
- Draw a class diagram showing classes, attributes, operations, and the four relationship types (association, inheritance, aggregation, composition) with correct arrowhead/diamond notation.
- Draw a sequence diagram showing lifelines, messages, activation boxes, and return messages, with time flowing top to bottom.
- Explain why UML is best used as a sketch rather than a formal blueprint, and describe the risks of analysis paralysis.
- Identify multiplicity constraints in a given domain and annotate them correctly on a class diagram.
Past Paper Questions
UML is a standard Part IA topic. You may be asked to draw a class or sequence diagram from a textual description of a system, or to critique a given diagram for missing relationships, wrong notation, or impossible multiplicities.