Intrinsic Evaluation: WCSS and Silhouette
What Is Intrinsic Evaluation?
Intrinsic evaluation requires no ground truth labels. It assesses cluster quality based solely on properties of the data and the clustering itself: how tight are the clusters? How well separated are they?

Two main intrinsic metrics: WCSS and Silhouette.
WCSS (Within-Cluster Sum of Squares)
Formula
where is the centroid of the cluster is assigned to (identified by ).
Interpretation
Lower WCSS means tighter, more compact clusters. A single cluster containing all points has high WCSS. Many singleton clusters (one point each) have WCSS = 0.
The Elbow Method
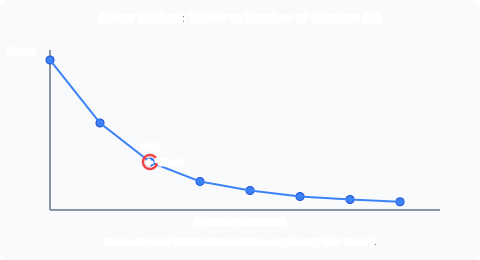
WCSS always decreases as increases (more clusters = tighter fit). The elbow method plots WCSS against and chooses the at the “elbow”: the point where the rate of decrease flattens sharply.
Procedure:
- Run K-Means for .
- Record WCSS for each .
- Plot WCSS vs .
- The optimal is the elbow: the last before diminishing returns set in.
Limitation: the elbow is often ambiguous for real-world data where WCSS decreases smoothly with no clear knee point.
Silhouette Score
Per-Point Formula
For a point assigned to cluster :
- = mean distance from to all other points in the same cluster (cohesion).
- = mean distance from to all points in the nearest other cluster (separation; the cluster with smallest mean distance to that is not ).
Interpretation
- near : point is much closer to its own cluster than to the nearest other cluster (well clustered).
- near : point lies on the boundary between two clusters.
- near : point is closer to a different cluster than its own (likely misclustered).
The overall silhouette score is the mean of across all points.
Advantages over WCSS
The silhouette score captures both cohesion and separation; WCSS only measures cohesion. Silhouette works for any distance metric, not just Euclidean. It can identify individual misclustered points.
Worked Example: Silhouette for One Point
Three clusters: , , .
Compute for point in .
Step 1: — cohesion within
Distances to other points in :
- To :
- To :
Step 2: — separation to nearest other cluster
Mean distance to :
- To : mean
Mean distance to :
- To : mean
is nearer, so .
Step 3:
The point is well clustered (close to its own cluster, far from others).
Summary
| Metric | Formula | Measures | Range | Best when |
|---|---|---|---|---|
| WCSS | Cohesion only | Low | ||
| Silhouette | Cohesion + separation | Near +1 | ||
| Elbow method | Plot WCSS vs | Optimal | — | Clear elbow |
| Intra-cluster mean distance | Cohesion | — | Low | |
| Nearest-cluster mean distance | Separation | — | High |
Past paper questions: y2024p3q7e